Appearance
We are excited to announce a significant upgrade to the Mixture Editor! To better support iterative recipe development and comparison, we have introduced a Substance Stack (A/B/C) system.
Previously, when you ran an optimization, the result was loaded into the "B" set of amounts. While this allowed for a quick comparison, it was limited. You couldn't easily compare three different versions of a recipe, nor could you "save" a version to compare against a future optimization without overwriting your main work.
The Solution: A, B, C Stack
We have expanded the mixture data model to store three distinct amount values for each substance: A, B, and C.
- Amount A: This is your Main active recipe. It is what's used for the mixing instructions, cost analysis totals, and sharing.
- Amount B: The previous version or a comparison point.
- Amount C: The "archive" version.
How it Works
The stack operates on a Push mechanism. When you run an optimization and it finds a feasible solution, the system automatically pushes the values onto the stack:
- C takes the value of B.
- B takes the value of A.
- A is updated with the New Optimization Result.
This means you never lose your previous work immediately. If you optimize and don't like the result, your previous "A" is safe in "B".
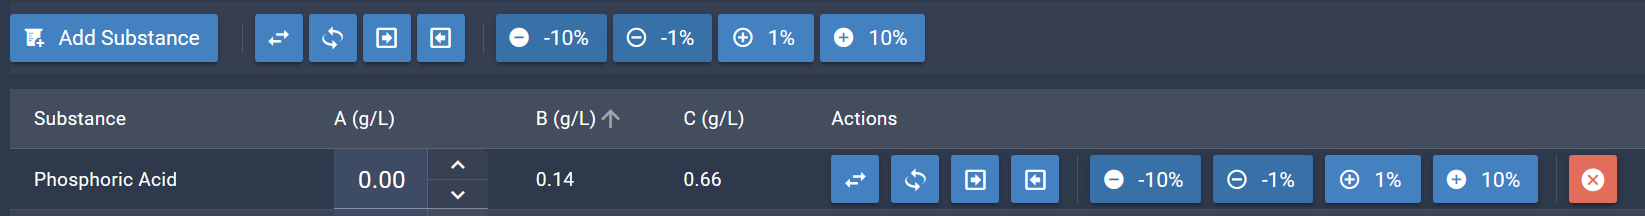
New Controls
- Roll Stack: A button to cycle the values: A → B → C → A. Use this to quickly swap between versions to see which one performs better in the analysis charts.
- Swap A/B: A quick button to just swap the primary and secondary amounts.
- Copy A→B / B→A: standard copy operations to overwrite one slot with another.
- Individual Roll: Each substance in the list now has its own "Roll" button, allowing you to cycle amounts for just that single ingredient.
Enhanced Analysis
All analysis tools now display data for all three stack positions:
- Nutrient Comparison: A new dedicated panel provides a side-by-side grid view of Total A, B, and C against your target, complete with delta percentages.
- Nutrient Analysis Grid: Focuses on the detailed breakdown of "Amount A", showing exactly how much each substance contributes.
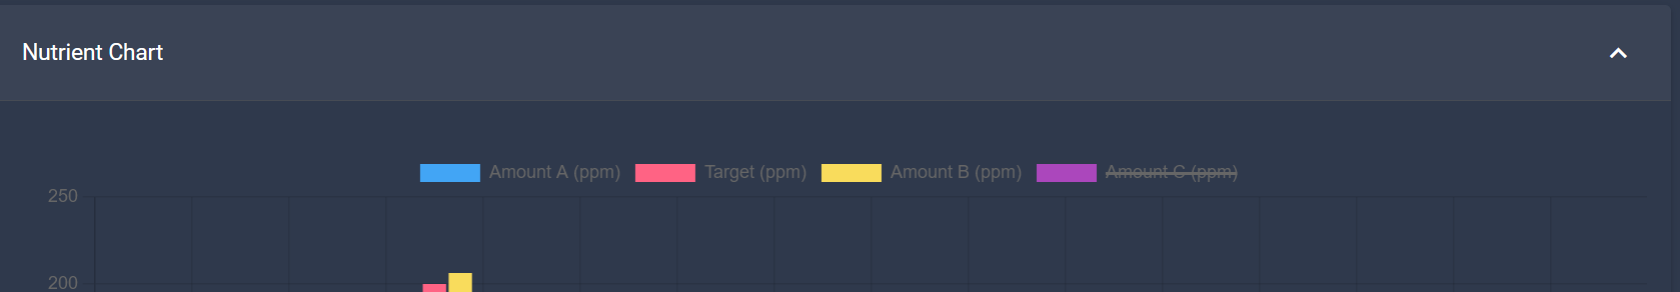
- Nutrient Bar Chart: Visualizes "Amount A" vs "Target" for a quick visual check. You can now click the legend items (Amount A, B, C, Target) to toggle them on and off, making it easier to focus on specific comparisons.
- Substance Table: Shows columns for A, B, and C amounts.
- Calculated Ratios: Compares ratios for all three versions.
- Cost Analysis: Breaks down cost metrics for A, B, and C.
This upgrade empowers you to iterate faster, compare multiple scenarios (e.g., "Current", "Cheaper", "More Precise"), and make data-driven decisions for your fertilizer recipes.