Appearance
Feed Logs
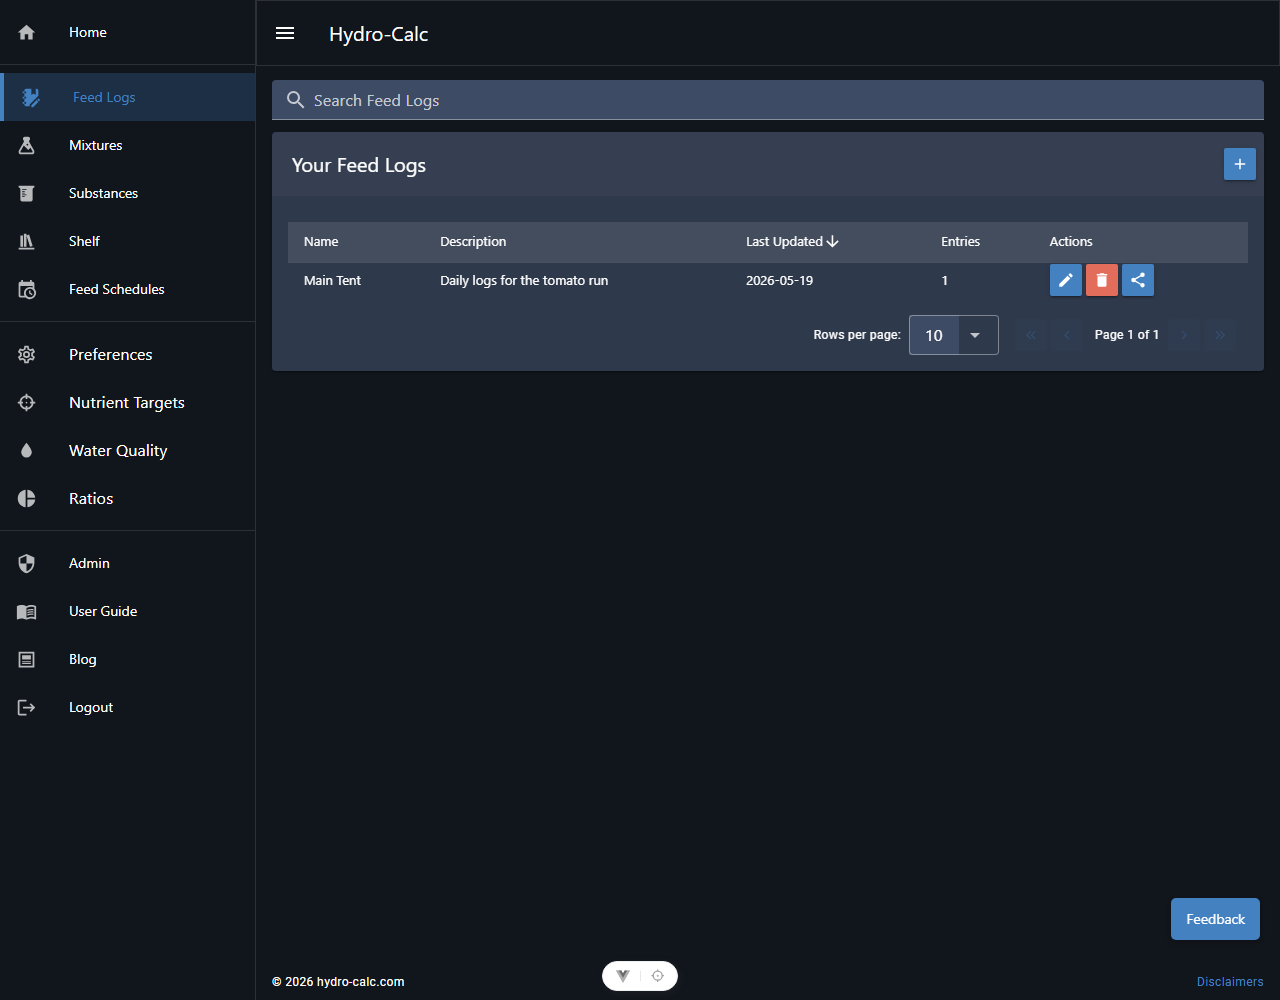
Feed Logs are your digital garden journal. They allow you to record every feeding, measurement, and observation throughout your grow cycle. By maintaining detailed logs, you can identify trends, troubleshoot issues, and optimize your future grows based on historical data.
Key Features of Feed Logs
- Track Measurements: Record pH, EC, and temperature for every feeding.
- Nutrient Usage: Automatically track how much of each substance you're using.
- Mixture Integration: Link logs directly to your mixtures to see exactly what formula was used.
- Analytics: Visualize your garden's health over time with built-in charts.
Managing Your Feed Logs
Creating a Log
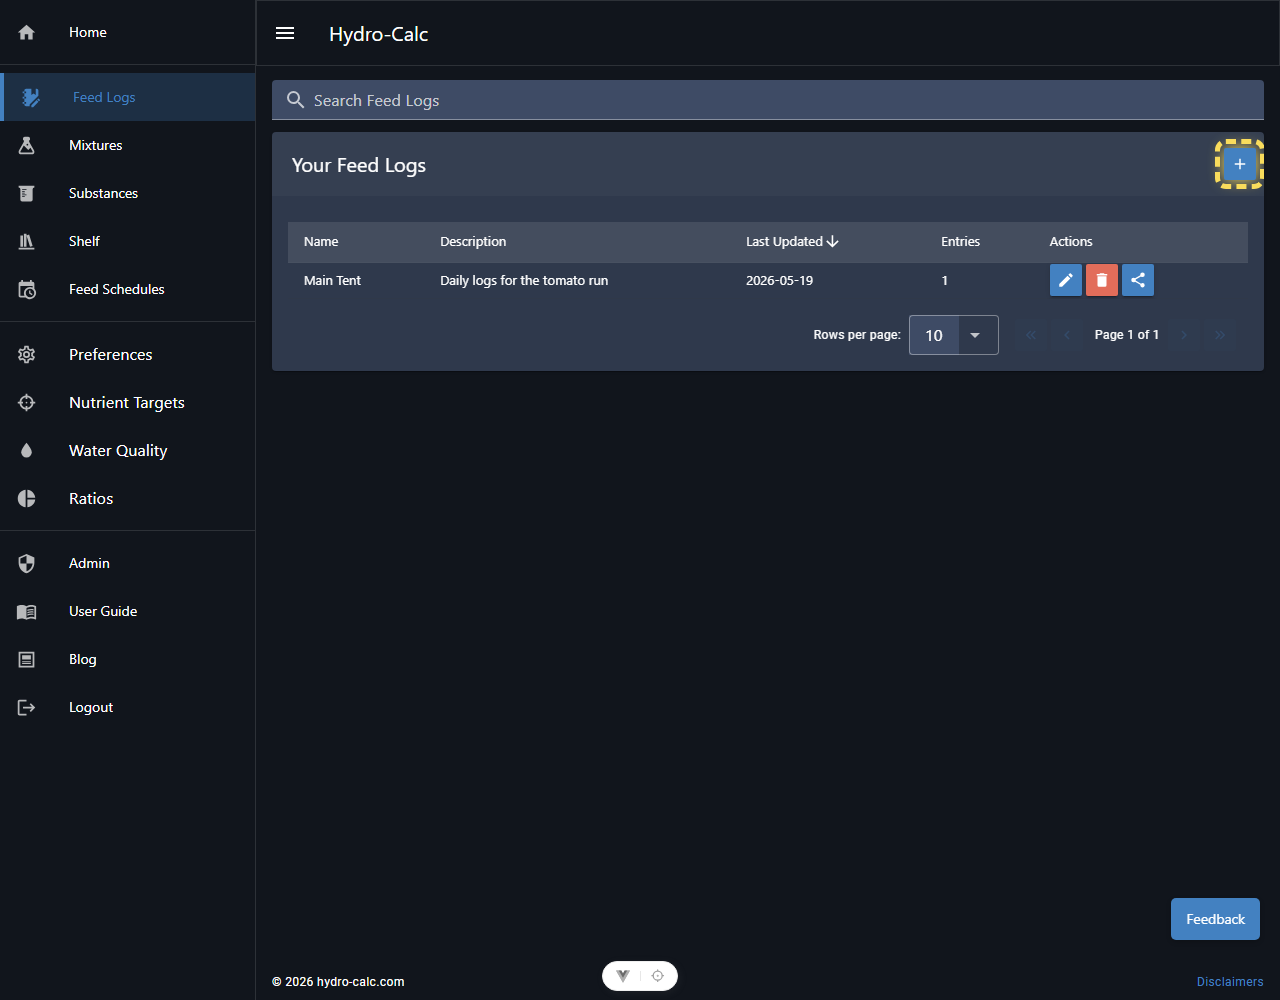
- Navigate to the Feed Logs page.
- Click Add New Feed Log.
Adding Entries
Inside a log, you can add entries manually or from a mixture.
- Manual Entry: Great for recording quick system status checks (pH/EC only).
- Add by Mixture: Choose one of your saved mixtures, and the log will automatically populate with the required substance amounts for your current water volume.
Smart Top-Off Calculator
The Top-Off tool is deeply context-aware:
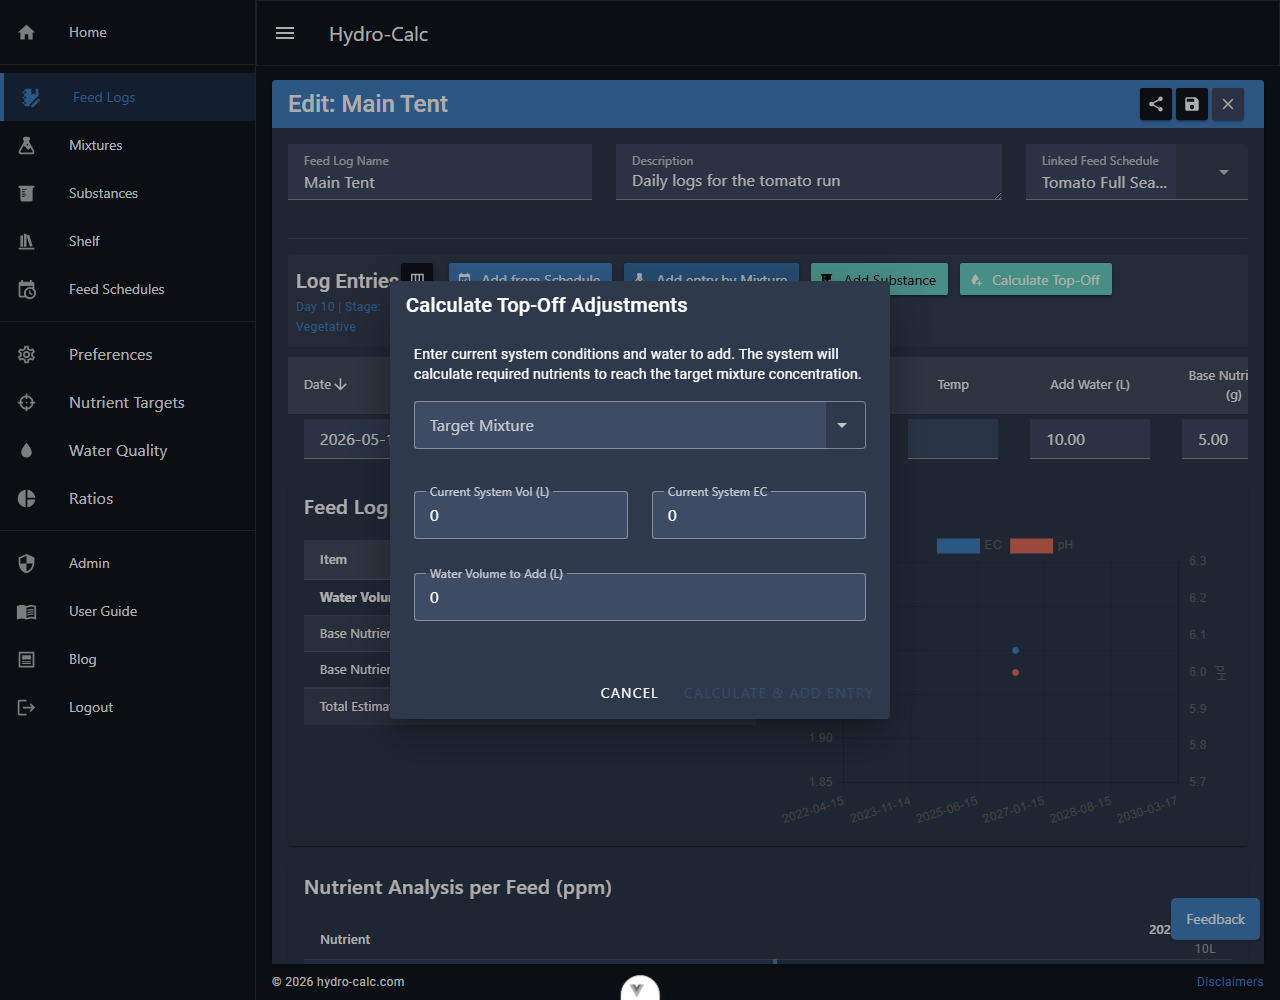
- Historical Memory: It automatically detects your last recorded EC and Volume to pre-populate calculations.
- Precise Adjustments: It calculates exactly how much fresh water or "target strength" mixture you need to add to bring your reservoir back to its desired parameters.
- Auto-Logging: Once you're happy with the calculation, a single click adds the detailed additions to your log.
Statistics and Analytics
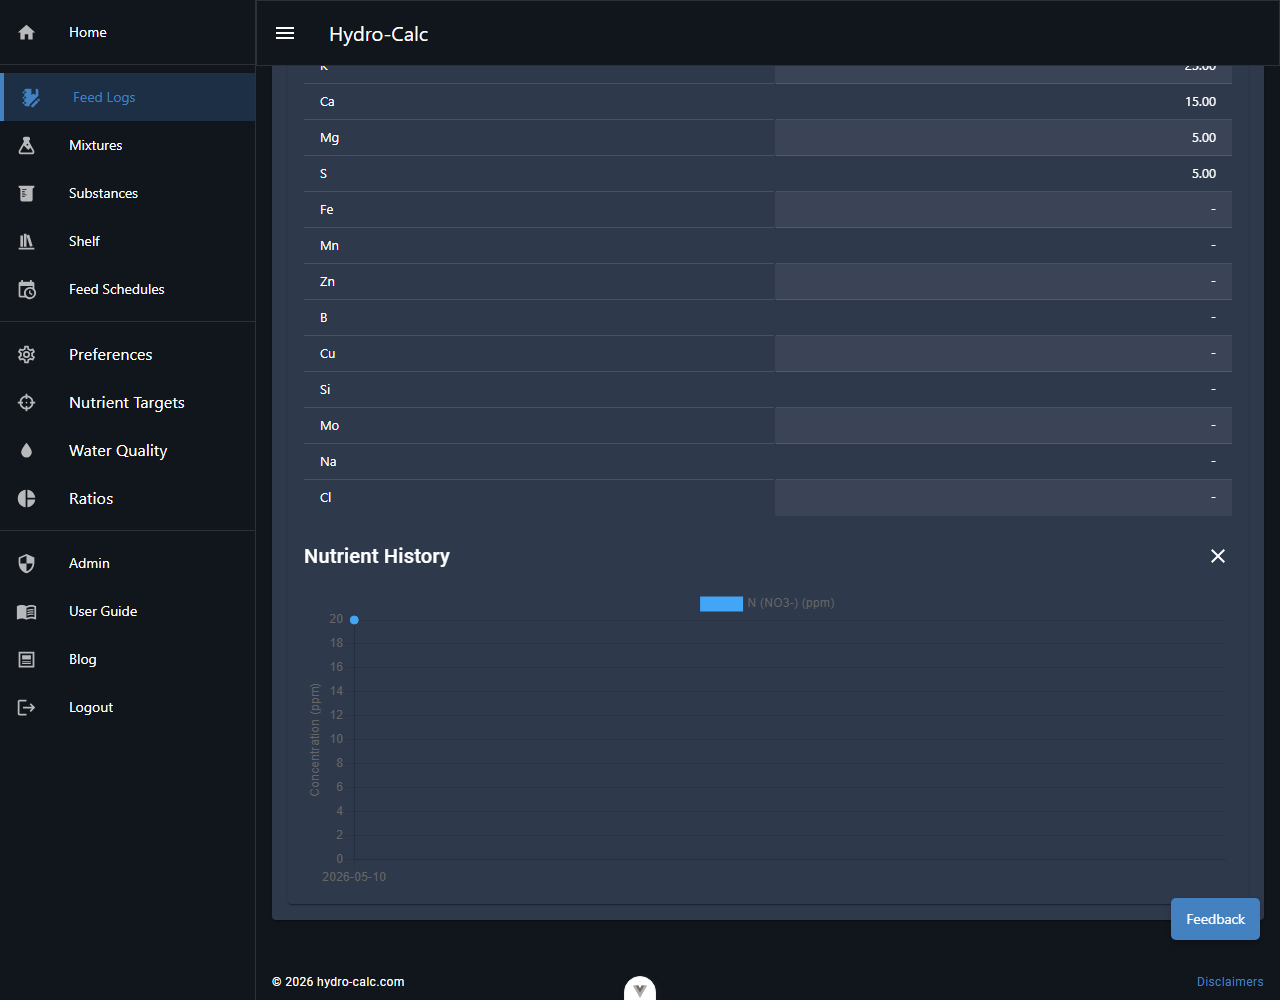
At the bottom of every log, the Feed Log Statistics section provides:
- Consumption Summary: Total water and nutrient mass used over the life of the log.
- Cost Analysis: Total financial investment based on your shelf prices.
- Trend Charts: Visual representation of pH and EC stability.
Privacy Note
Your personal financial data is never shared. The "Cost" column and cost statistics are automatically hidden in the shared view, so you can share your technical results without revealing your budget or supplier pricing.